|
page three
|
|
Open the histogram window by clicking on the histogram icon in the PSP toolbar.
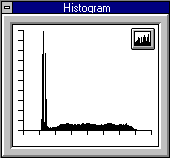
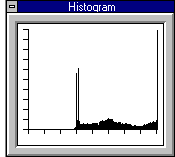
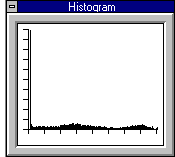
The histogram is a graph of the luminance, or brightness, of the colours in your active image. The horizontal axis measures the luminance spectrum, from pure black on the left to pure white on the right.
|
|

|
|
Notice how this image, full of white and light grey, has a histogram that is shifted towards the right side of the horizontal axis.
|
|


|
|
While this image, with a more black, dark grey, and white, has a histogram that lies fairly flat and evenly spread along the horizontal axis.
For this lesson, try to adjust the histogram so it is shifted towards the middle or even slightly right.
|
|


|
 
|


